

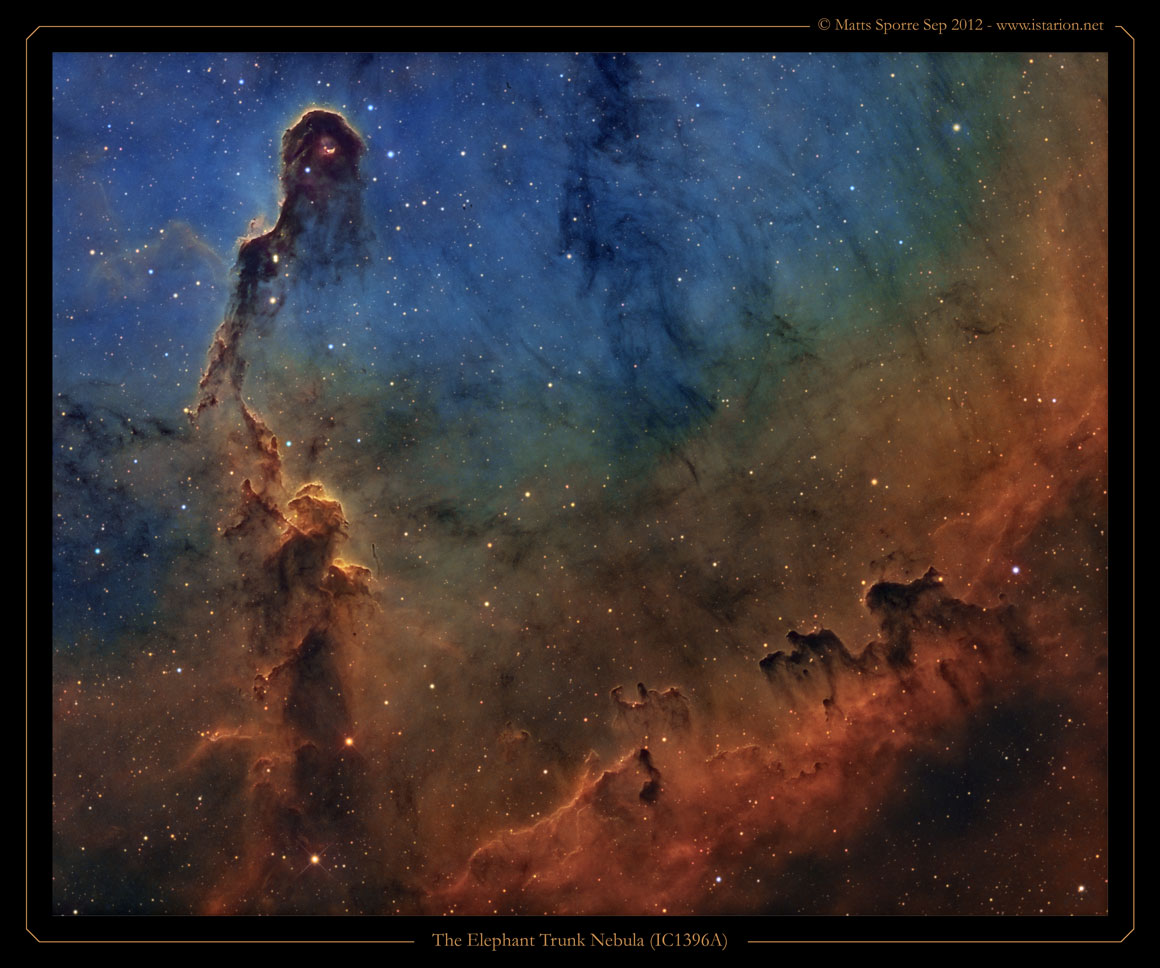
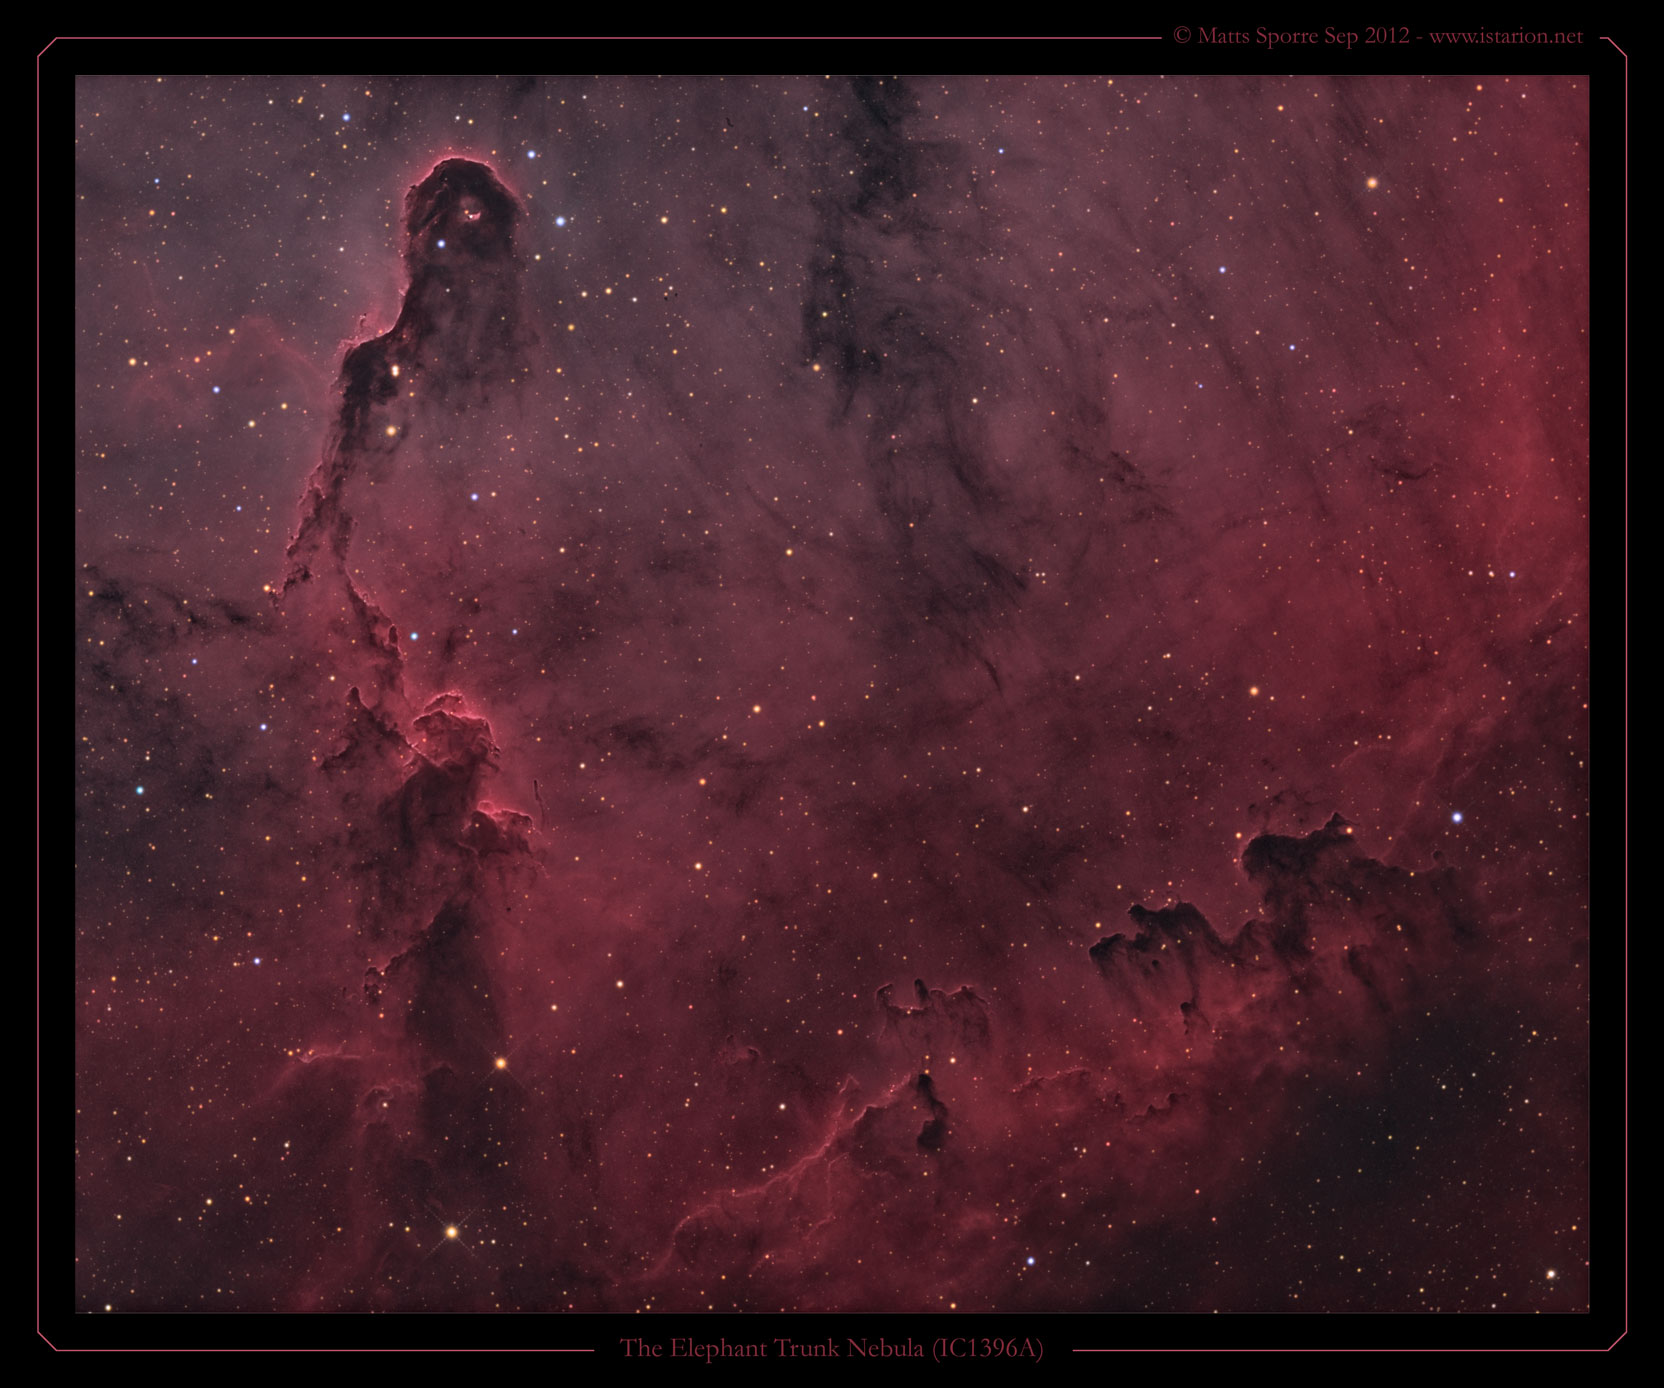
The Elephant's Trunk nebula is a concentration of interstellar gas and dust in the star cluster IC 1396 – an ionized gas region located in the constellation Cepheus about 2,400 light years away from Earth. The piece of the nebula shown above is the dark, dense globule IC 1396A; it is commonly called the Elephant's Trunk nebula because of its appearance at visible light wavelengths, where there is a dark patch with a bright, sinuous rim. The bright rim is the surface of the dense cloud that is being illuminated and ionized by a very bright, massive star that is just to the west of IC 1396A. (In the Figure above, the massive star is just above the top of the image.) The entire IC 1396 region is ionized by the massive star, except for dense globules that can protect themselves from the star's harsh ultraviolet rays.
The Elephant's Trunk nebula is now thought to be a site of star formation, containing several very young (less than 100,000 yr) stars that were discovered in infrared images in 2003. Two older stars are present in a small, circular cavity in the head of the globule. Winds from these young stars may have emptied the cavity.
The combined action of the light from the massive star ionizing and compressing the rim of the cloud, and the wind from the young stars shifting gas from the center outward lead to very high compression in the Elephant's Trunk nebula. This pressure has triggered the current generation of protostars.
The above text is taken from Wikipedia.
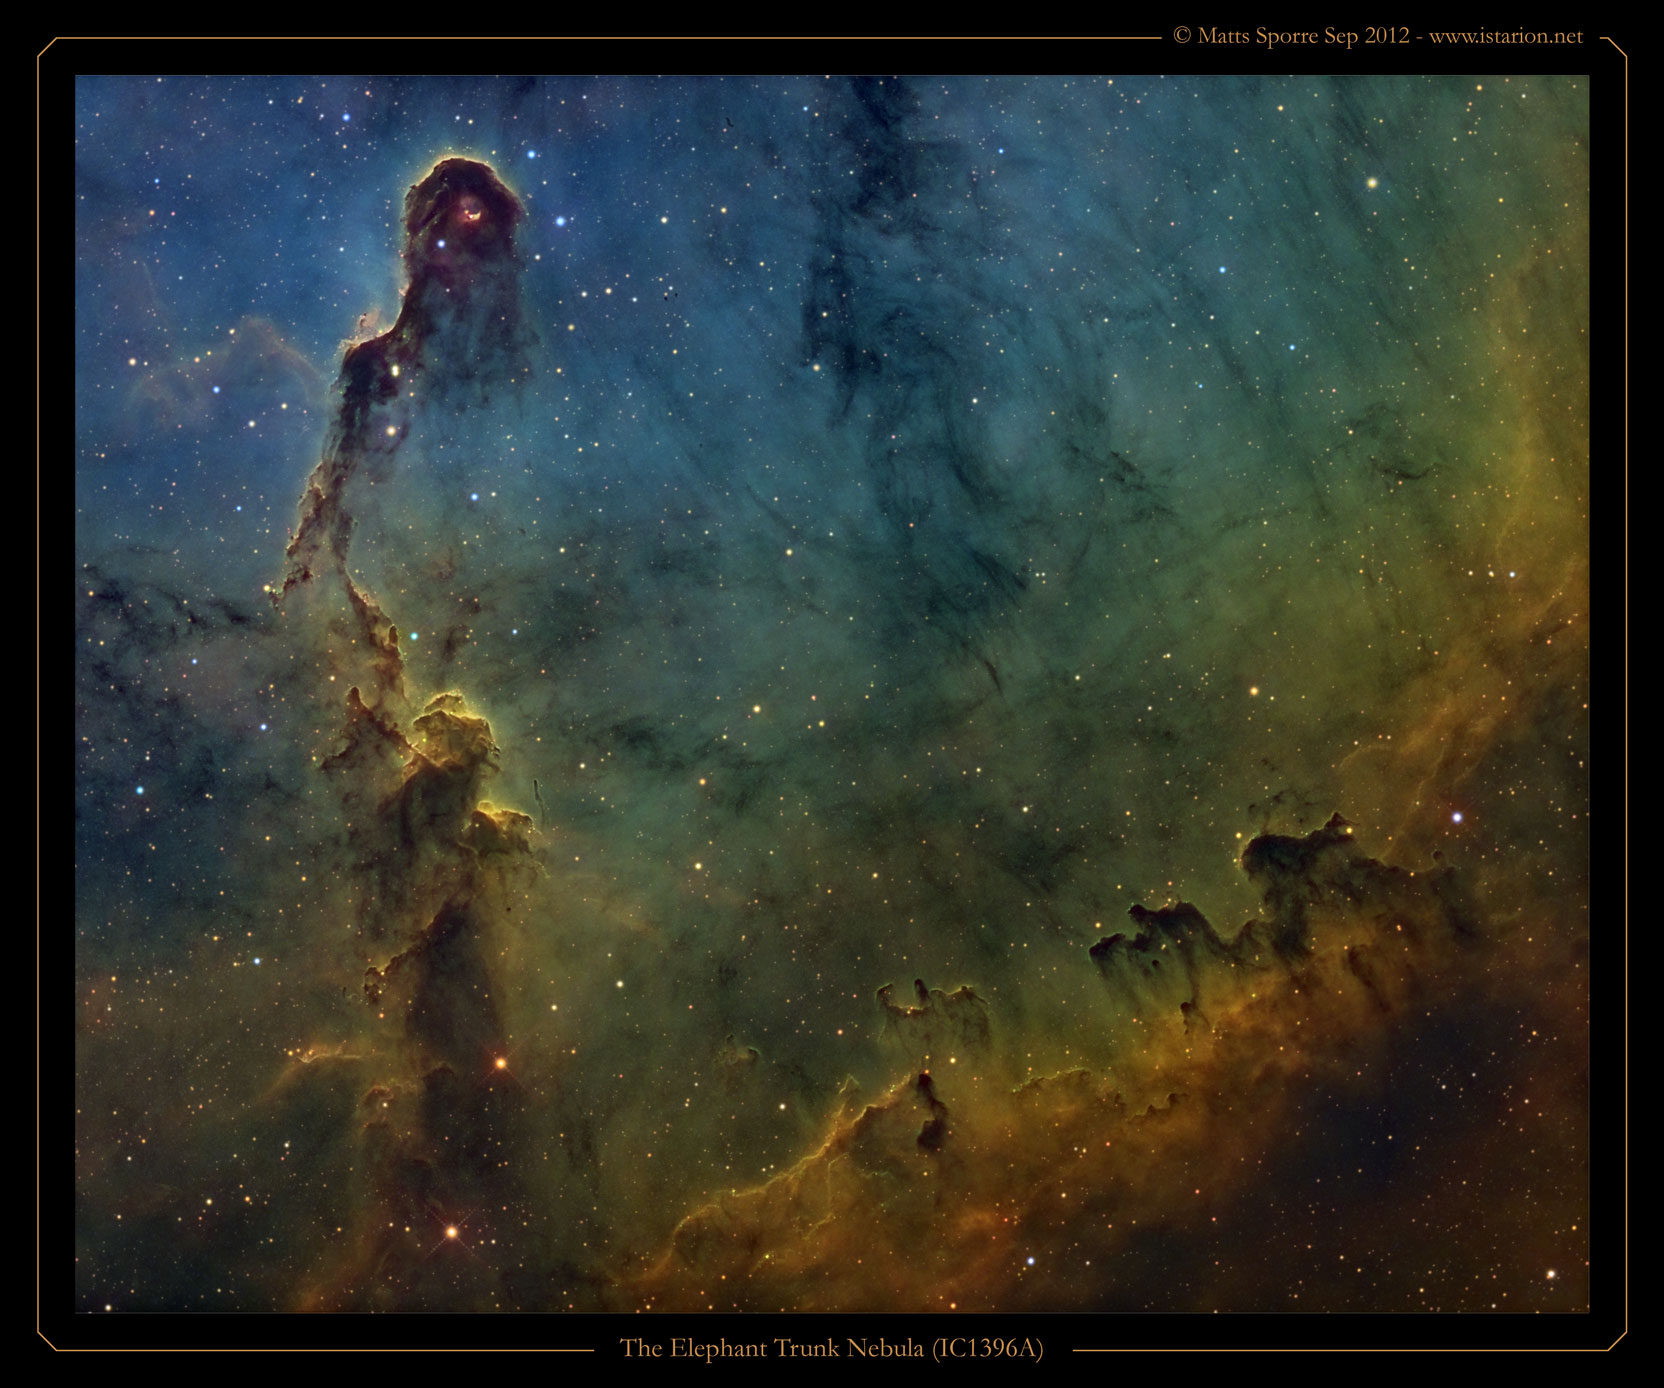
These images are six different combinations of three narrowband images (Ha, OIII and SII).
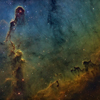
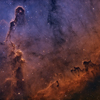
The first one is the familiar Hubble composition where the Ha, OIII and SII images has been adjusted so that they all have similar histograms. In this way the OIII and SII contribution will show up. If this histogram equalization is not done, the image will be dominated by the Ha channel, i.e. it will be green.
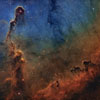
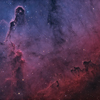
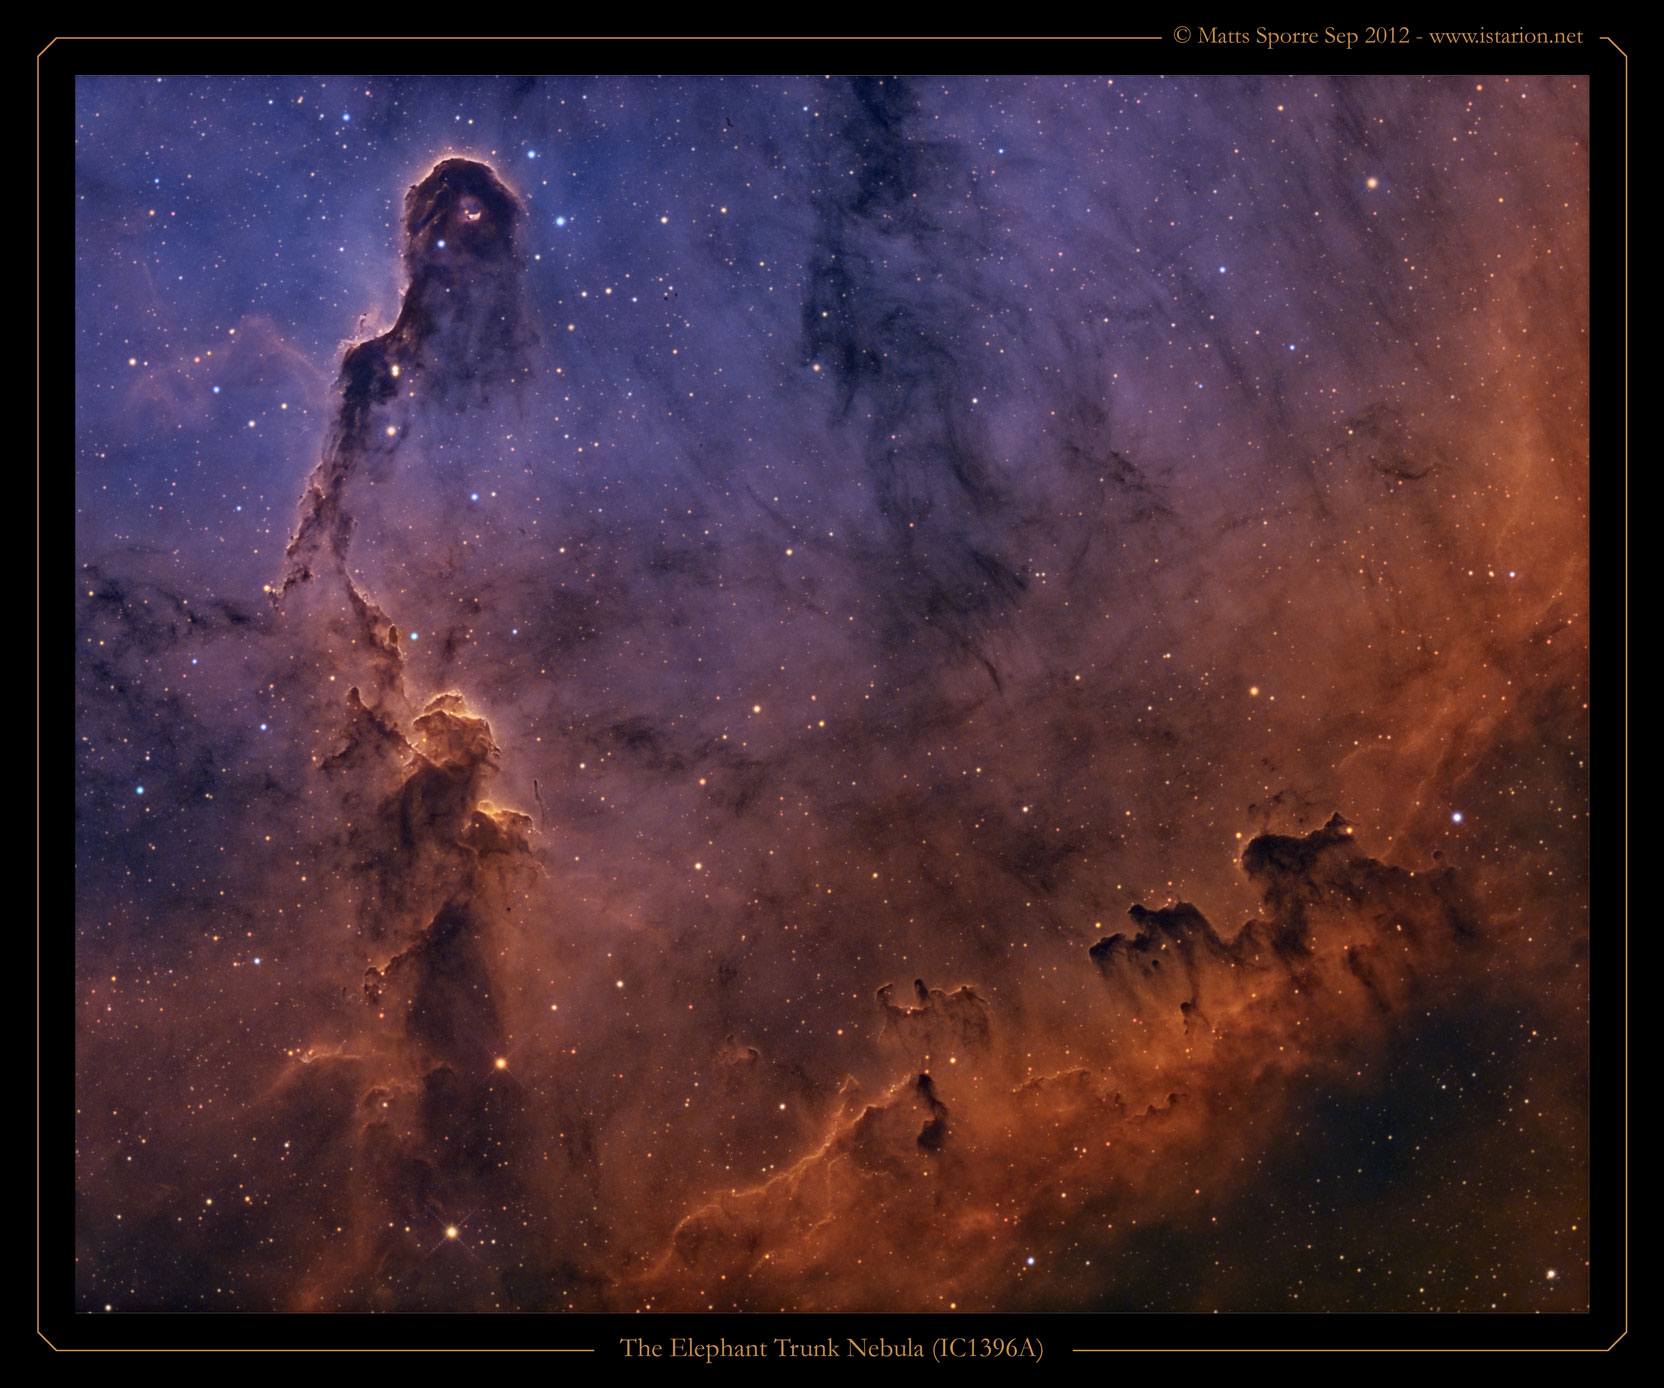
The second one is based on the first, to which a colour shift has been applied Photoshop's Selective Color tool (see Bob Frankes tutorial). One has to be very careful when using the Selective Color tool in PS, since it is easy to shift to much resulting in sharp borders between blue and yellow.
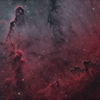
The third one is a modification to the Hubble composition. Instead of assigning Ha to green I assigned Ha to orange (Hue = 35 in PS notation), SII to red (as in Hubble) and OIII to a slightly more turquoise hue (Hue = 210 in PS notation). This palette has the advantage of separating the different narrowband images (as do the Hubble colour shifting composition), but has the advantage of not being dependent on careful usage of the Selective Color tool.
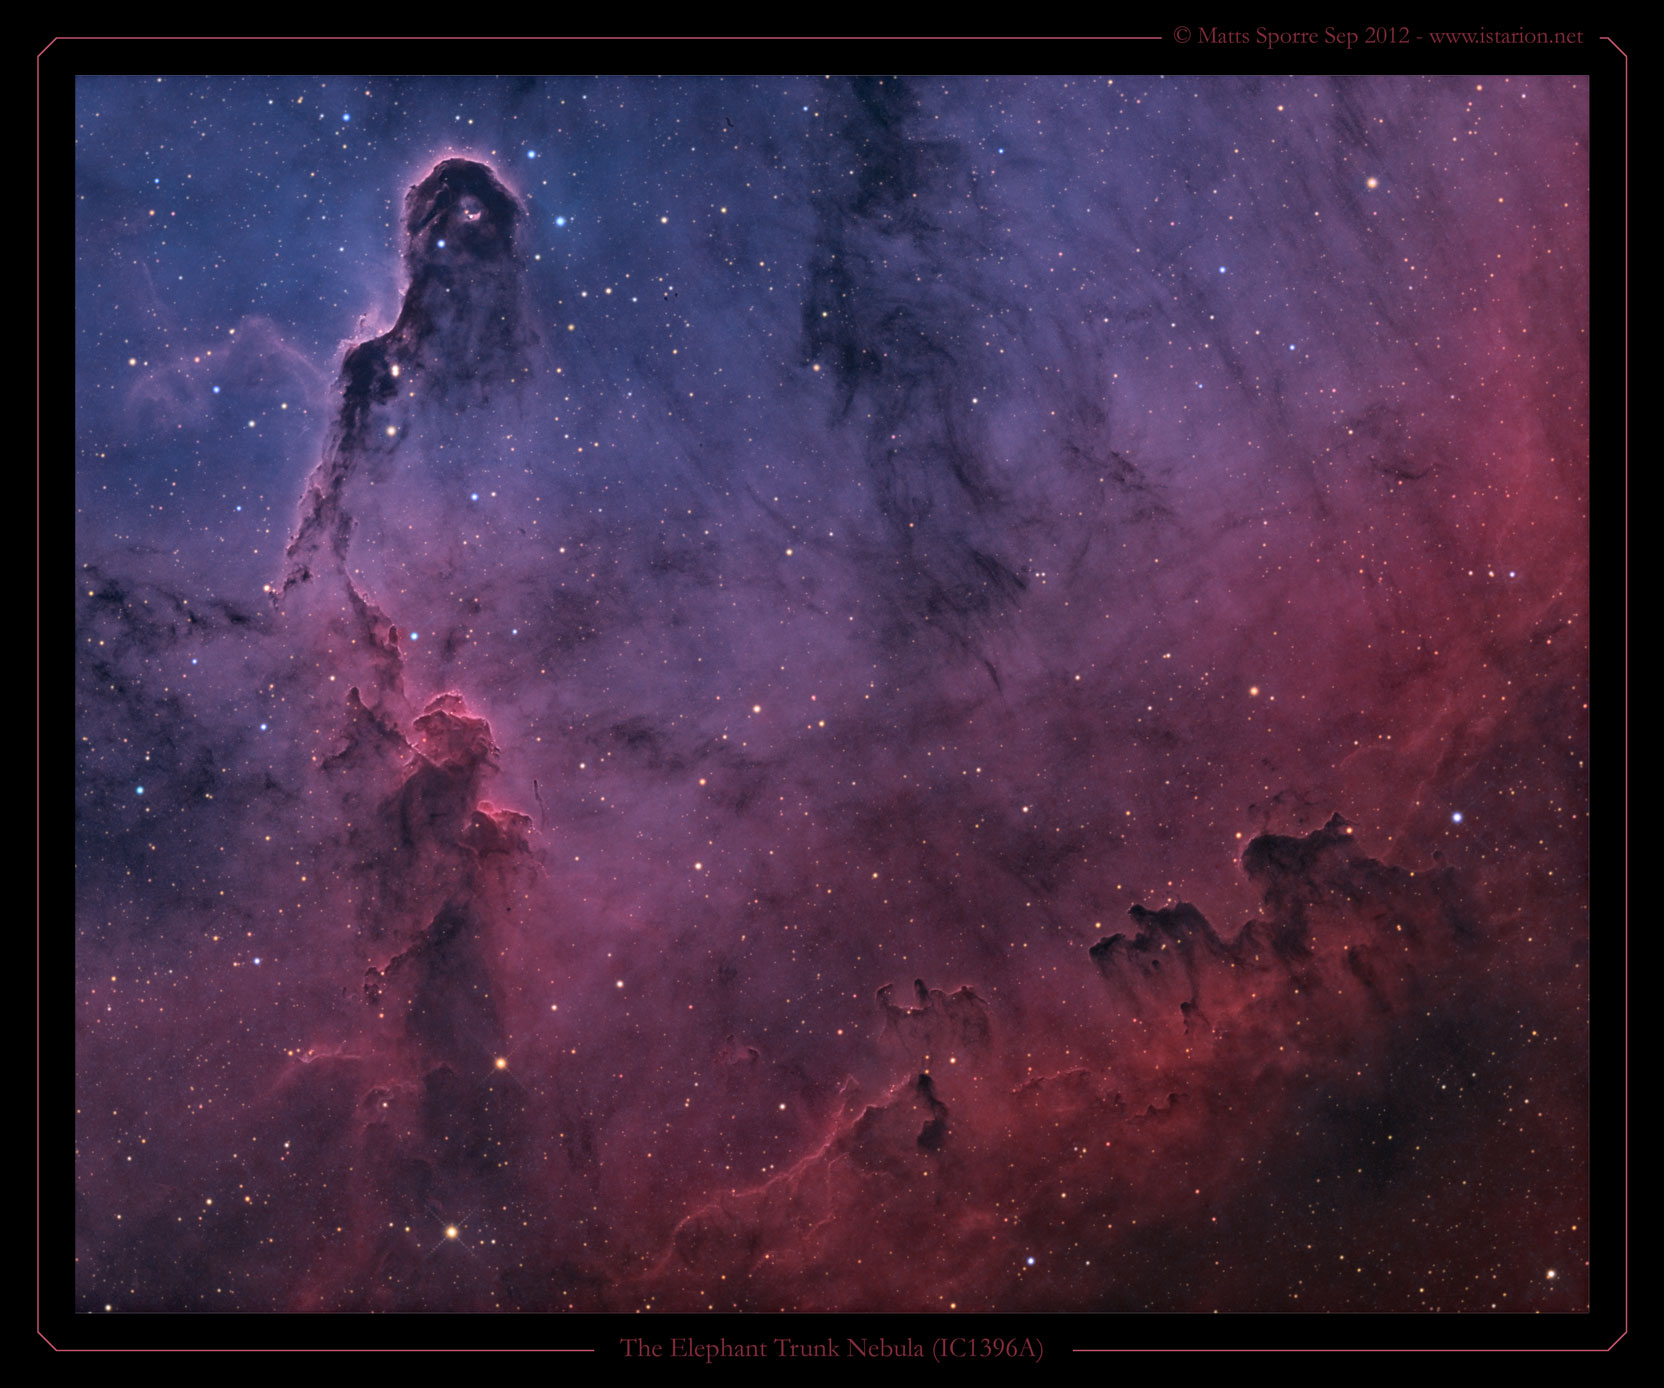
The fifth one is an attempt at mapping the narrowband images to colours so that the image would mimic the result of a broadband RGB image. It has been constructed by using the fact that H-beta emission (blue) accompanies the H-alpha line (red) with H-beta roughly 15% of the strength of the H-alpha. To the best of my knowledge this was first suggested by Richard Crisp. It also uses the fact that OIII is positioned in-between the blue and green part of the spectra. A litte bit of SII is added to the red channel.
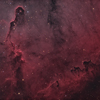
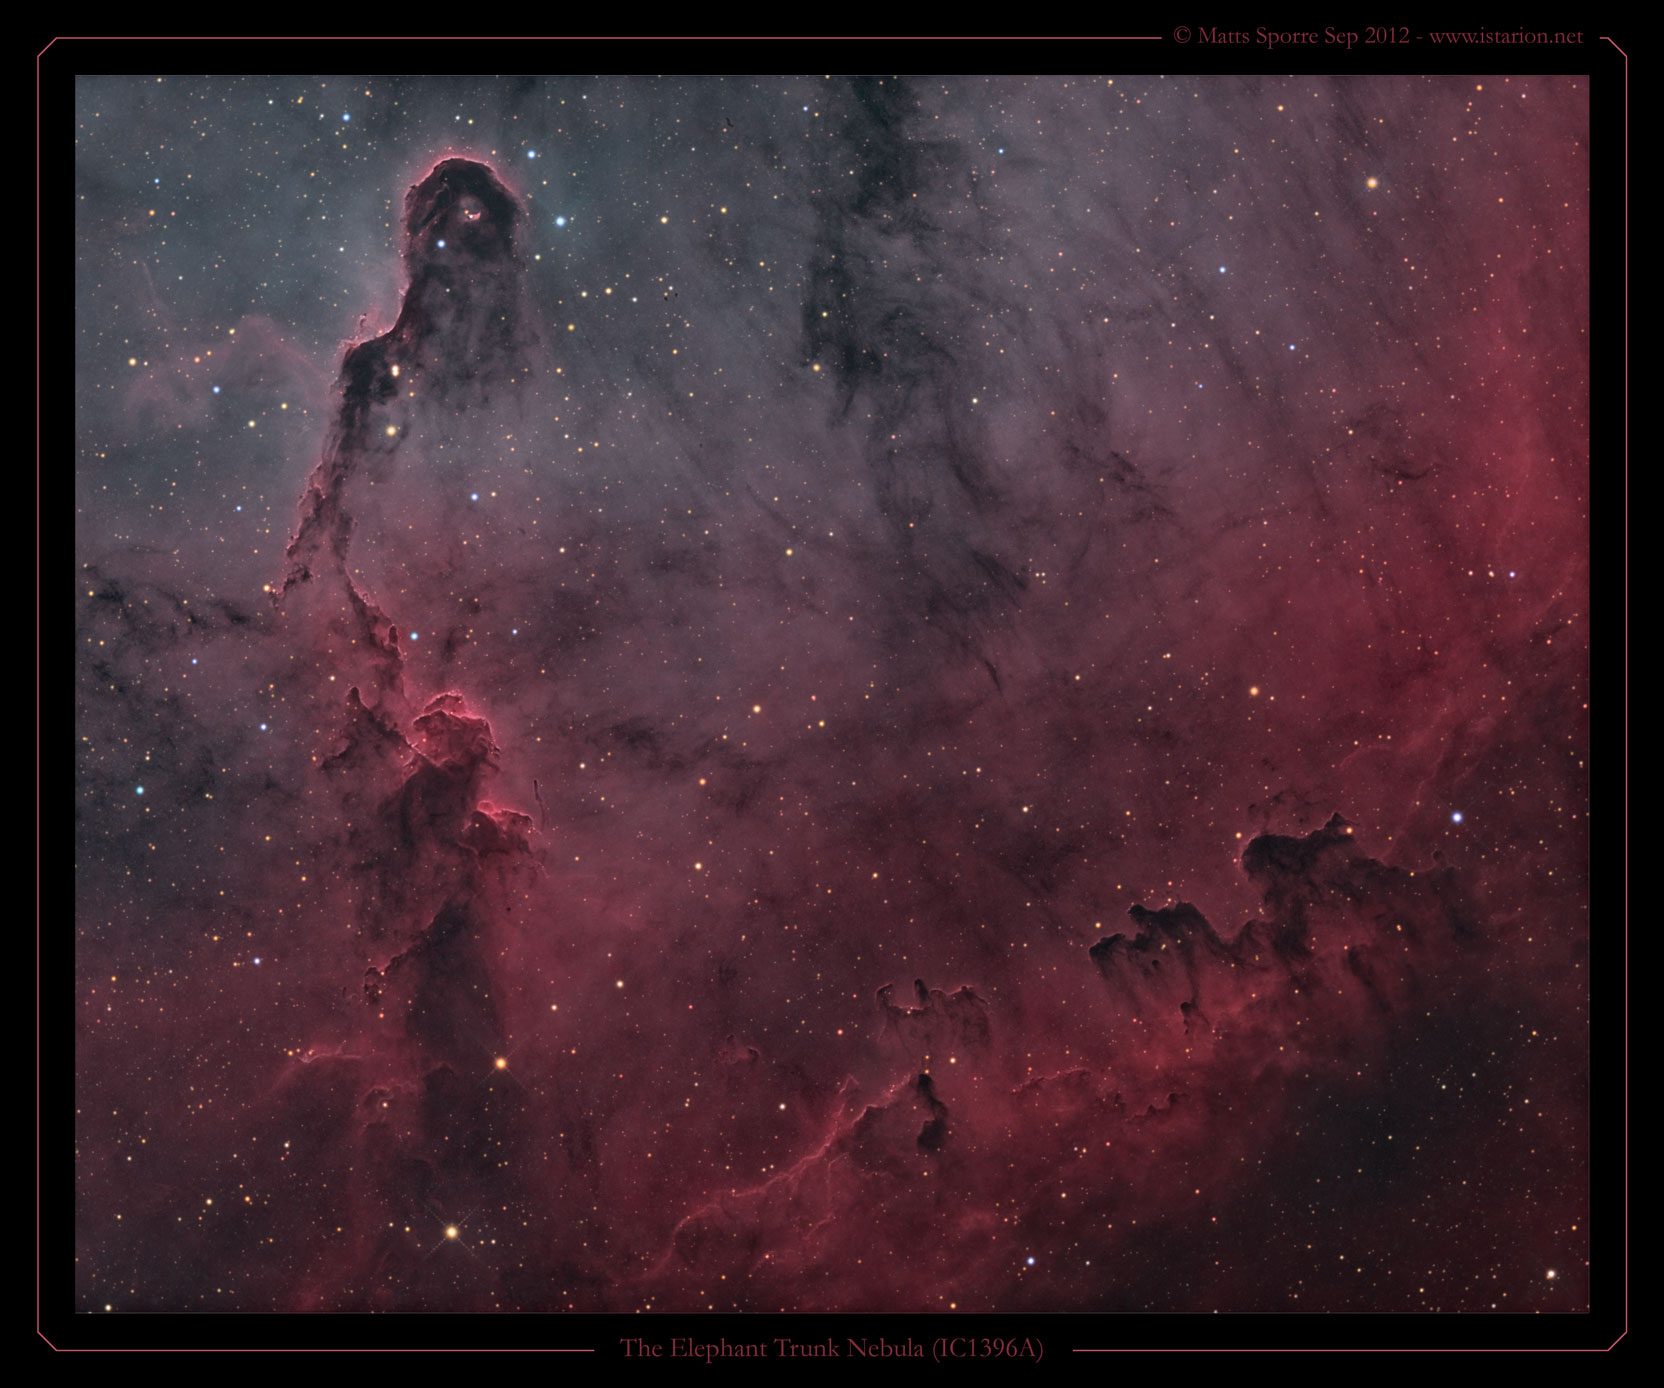
The fourth and sixth images are variations of the fourth in the way one treats the OIII data. In the sixth I have decreased the OIII contribution in order to make the nebula redder - which is perhaps closer to a real RGB representation. In the fourth I have pushed the OIII data more towards blue to show the OIII regions better, but still in a red nebula representation.
In order to make most use of the weak OIII and SII data I have also used JP Metsavainio's Tone Mapping technique. A pdf that outlines tone mapping can be found here, and in order to bring out as much details as possible I have followed some of the tutorials on Ken Crawford's site.
By "mouse over" on the thumbnails above you can see:
- Image details: Equipment used, number of subs etc.
- Hubble standard: Red = SII, Green = Ha, Blue = OIII, Lum = Ha + OIII + SII. Then stretching each channel so that their histograms match.
- Hubble color shift: Starting from Hubble standard and shifting colours as described inBob Frankes tutorial.
- Hubble modified: Orange = Ha (hue=35), Red = SII (hue=0), Blue/Turquoise = OIII (hue=210) , Lum = Ha + OIII + SII.
- RGB bluer: Same as RGB standard but the OIII contribution to the blue channel has been dialled up to make the OIII area more visible.
- RGB standard: Red = 80%Ha + 20%SII, Green = OIII, Blue = 85%OIII + 15%Ha, Lum = Ha + OIII + SII
- RGB less OIII: Same as RGB standard but the OIII contribution has been dialled down to get closer to a real RGB image.
Click on the image name in the list to load a larger version.
Below you see images for each emission line respectively. The images has been stacked and stretched so that the histogram peak is equal for each of them. Note that the binning of the OIII and SII data was 3x3. This mean that each pixel receives 9 times as many photons compared to 1x1 binning. Thus a 4hr exposure would correspond to a 36hr exposure binned 1x1. Binning 3x3 of course looses detail, which in this image has been compensated by constructing a luminance using the H-alpha image with a touch of the OIII and SII data in it.
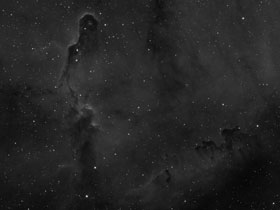
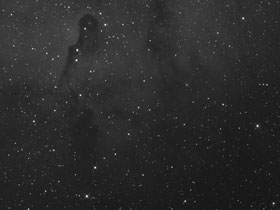
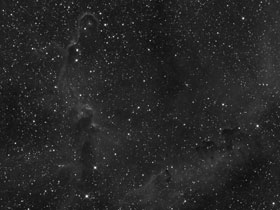
Ha OIII SII
The following software has been used. MaximDL (image acquisition and guiding), CCDStack (calibration and RGB scaling, PixInsight (cropping, background correction, colour corrections) and Photoshop CS5 (all the rest, incl Noel Carbonis Astronomy Tools), and finally JP Metsavainio's Tone Mapping technique.
This image was processed in September 2012
Copyright: All images © 2012 Matts Sporre. All Rights Reserved